
Monitoring the most problematic performance problem in Dynamics AX - parameters sniffing
June 09, 2021
One of the complex and probably most common problems in Dynamics AX performance tuning is SQL parameters sniffing. I recently wrote how to fix it, but in this post, I want to focus on a sample approach of how to implement a monitoring solution for such types of problems.
Parameters sniffing example
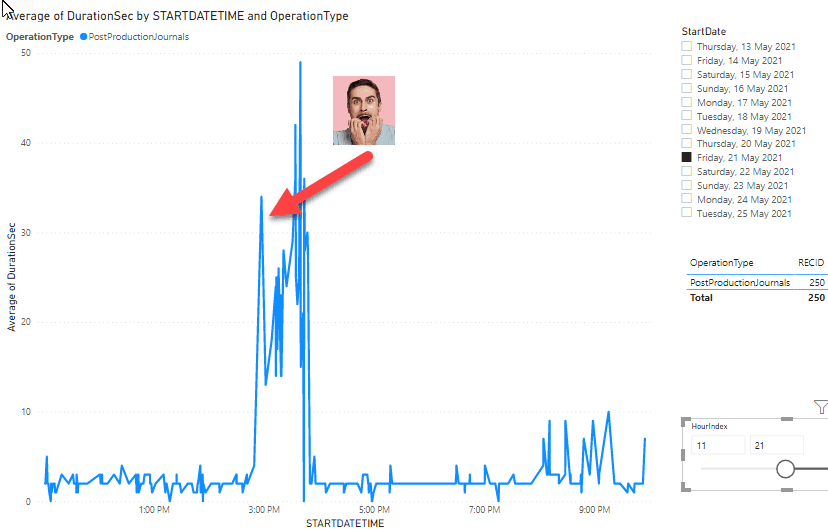
Let's consider an example from the recent project. One of the critical system processes was a Production journal time posting. After the general optimization, it worked within acceptable time(around 5 seconds) but then on Friday at 3 pm it suddenly slowed down (like 30-50 seconds to post the journal, which affected a lot of users)
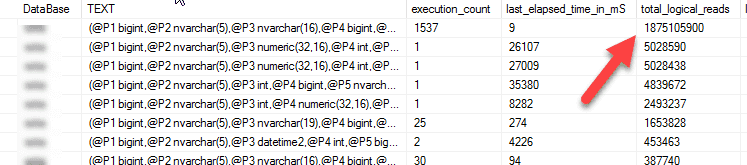
TOP SQL for the server looked like this(one TOP1 statement with considerably larger logical reads)
When I checked the plan for this TOP1 statement it was the following
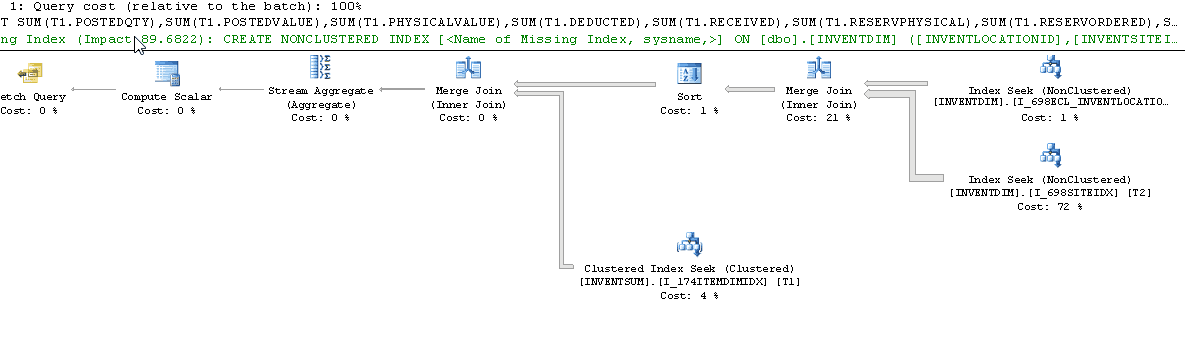
This is a "classic" example of wrong InventSum-InventDim join, where InventDim is used as a leading table.
The solution was quite simple, a custom plan was created with the OPTIMIZE FOR UNKNOWN hint, that ensured that SQL Server would not use first passed location/site values to build a plan
EXEC sp_create_plan_guide @name = N'[AX_InventSumLoc]', @stmt = N'SELECT SUM(T1.POSTEDQTY),SUM(T1.POSTEDVALUE),SUM(T1.PHYSICALVALUE),SUM(T1.DEDUCTED),SUM(T1.RECEIVED),SUM(T1.RESERVPHYSICAL),SUM(T1.RESERVORDERED),SUM(T1.REGISTERED),SUM(T1.PICKED),SUM(T1.ONORDER),SUM(T1.ORDERED),SUM(T1.ARRIVED),SUM(T1.QUOTATIONRECEIPT),SUM(T1.QUOTATIONISSUE),SUM(T1.AVAILPHYSICAL),SUM(T1.AVAILORDERED),SUM(T1.PHYSICALINVENT),SUM(T1.POSTEDVALUESECCUR_RU),SUM(T1.PHYSICALVALUESECCUR_RU) FROM INVENTSUM T1 WHERE (((T1.PARTITION=5637144576) AND (T1.DATAAREAID=N''dsg'')) AND ((T1.ITEMID=@P1) AND (T1.CLOSED=@P2))) AND EXISTS (SELECT ''x'' FROM INVENTDIM T2 WHERE (((T2.PARTITION=5637144576) AND (T2.DATAAREAID=N''dsg'')) AND (((T2.INVENTDIMID=T1.INVENTDIMID) AND (T2.INVENTSITEID=@P3)) AND (T2.INVENTLOCATIONID=@P4))))',
@type = N'SQL',
@module_or_batch = null,
@params = N'@P1 nvarchar(21),@P2 int,@P3 nvarchar(11),@P4 nvarchar(11)',
@hints = N'OPTION (OPTIMIZE FOR UNKNOWN)'
The correct plan after this became the following:
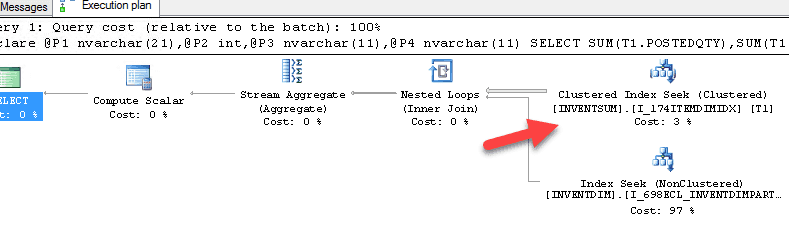
After the hint creation, the posting time returned to normal.
As I wrote in my previous post the insidiousness of such cases is that sometimes people start using reindexing or statistics updates to resolve them, and its slow down the whole system without actually fixing the root of this problem. Such maintenance tasks can lead to Index Maintenance Madness and even Microsoft recently published some notes about this
Let's discuss how we can monitor such issues
TOP Queries monitoring solution implementation
Such problems are quite easy to fix, the main complexity is that they can hit your system unexpectedly. But the pattern is always very similar: a new TOP SQL statement that uses a non-optimal execution plan. Also, you can't monitor it using standard performance counters(for example CPU load) on SQL Server, as in most cases they may not hit critical levels(for example it may change from 20% to 50%).
I tried to google a monitoring open-source solution that could handle such situations but could not find anything. So to be notified on such events I created the following Dynamics AX query performance monitoring procedure:
msdb.dbo.[AXTopQueryLogMonitor] @MinPlanTimeMin = 30, @MaxRowToSave = 3, @SendEmailOperator = 'axoperator', @DaysKeepHistory = 62The idea is very simple. Every 30 minutes this procedure obtains 3(@MaxRowToSave) TOP records from the current SQL Server TOP SQL view and if they exist in this log for more than 30 minutes(@MinPlanTimeMin) saves them to a table. If any of these 3 statements is new, it sends an e-mail about this to a specified operator(@SendEmailOperator). To prevent this log from growing it deletes records older than 62 days(@DaysKeepHistory)
To compare with previous statements both SQL plan and SQL text are used, so if one query is executed with different plans it appears twice in this log.
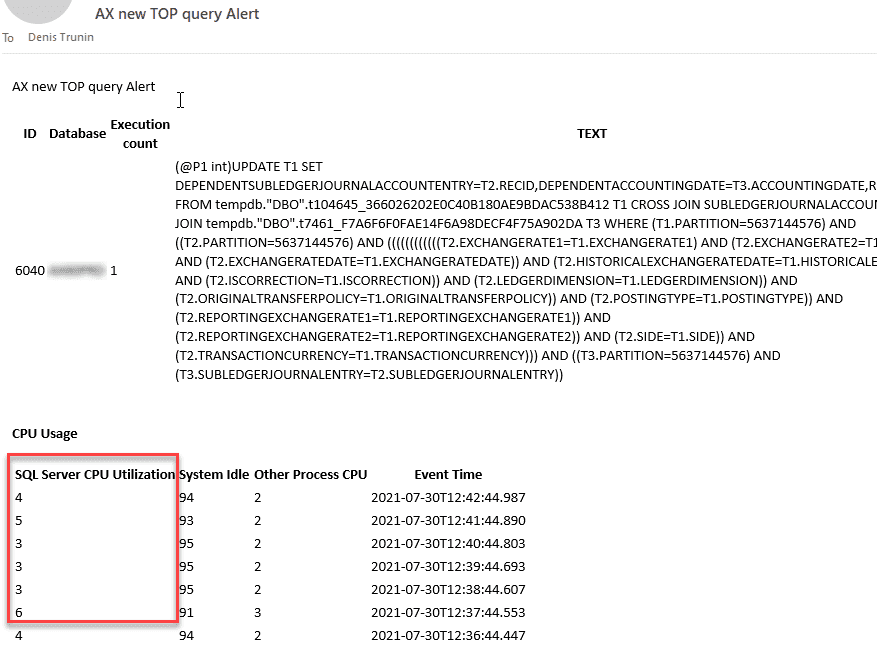
As the result, if you have a new TOP statement that you have not seen before, Dynamics AX Administrators should get an email like this
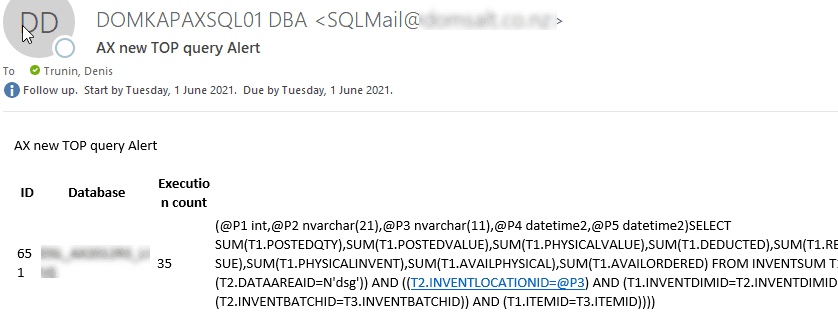
UPDATE 30/07/2021
Sometimes in a “TOP query log” there were some queries that are not heavy at all, but they exist in the TOP log because the overall server load is low(for example less than 5%). To view this, I added a new section in the alerting e-mail that displays CPU Utilization
Then they can connect to SQL Server and try to analyse/optimize this statement

If the statement can not be optimized, for example, Execution count is aligned with the current business logic and Execution plan is optimal you can mark this query as approved
Exec [AXTopQueryMarkAsApproved] 111, 'Query is good, used in planning process'Examples from real-life projects
I ran this monitoring on several projects where all Dynamics AX performance tuning was made during the previous audit and got the following results:
- Number of queries that need to be analysed was within 100-200 queries. Basically, if you want to support Dynamics AX performance you need to be ready to analyse your system’s top heaviest 200 queries.
- Duration of initial analysis - it was about 2-3 calendar weeks, more than I had expected. In this period I was getting several new emails per day
- Number of fixed queries - for one project it was 8. 4 queries had an incorrect plan and 4 required new indexes creation. These numbers may not seem high, but keep in mind that previously most performance issues on this project were fixed by the performance audit.
What is really great about this solution is that it gives a certain level of confidence during the Dynamics AX performance optimization project. If a new SQL query appears at the TOP log you will be notified about this.
Some thoughts about D365FO
If you have an on-premise version the monitoring will be the same. For the Cloud version, you don't have a direct access to a Production SQL Server. But the production database has a Query store enabled and information like "TOP queries for the given time" can be obtained using the SAT restore with a read-only flag. The process is described in the following post Using Query Store for Performance Tuning with D365 F&O, but it looks quite complex from a practical point of view(SAT often is used for some other tasks and this restore will take some time)
Probably another option is to implement the same monitoring logic in X++ and run it as a periodic batch job.
Conclusion
Using the described solution you can monitor your Dynamics AX SQL performance and get a notification when some new workload appears in a TOP SQL list. This is extremely useful for the cases when you have random performance problems that can't be replicated on a Test version. You can find and fix exact queries that causing problems instead of wasting time by running reindexing/statistics update.
The code for this can be found in the following folder.
I hope you find this information useful. Don't hesitate to contact me in case of any questions or if you want to share your Dynamics AX/D365FO SQL monitoring approach.
Tagged with:
Written by Denis Trunin
Similar posts:
- Understanding Dynamics 365FO different Tiers performance
- Do we really need index hints? (forceLiterals vs forcePlaceholders)
- Implementing Dynamics AX 2009/2012 database cleanup
- Implementing of Dynamics AX business operations performance monitoring
- Comparing D365FO development VMs performance
- Dynamics AX performance monitoring: missing indexes