
Resolving performance issues caused by parameters sniffing in AX2012 and D365FO
May 07, 2020
Let's discuss how AX performance problems caused by "parameters sniffing" may be resolved when you have on-premise system and access to SQL Server and for Dynamics 365 Finance and Operations.
AX2009/AX2012 on-premise
One of our clients reported a problem that his users complained about a slow AX performance. There was not just one operation, the general complain was something like: "System is very slow today - Posting is slow and invoicing is slow". When I logged in to the SQL box, the first metric I saw was a high CPU utilization that was above normal for this client.
After executing a top SQL query, I saw the following result. The first query took more than ten times logical reads than the second one.

The query was quite simple - get the last cost price for the item
@P1 nvarchar(5),@P2 nvarchar(21),@P3 int,@P4 datetime,@P5 nvarchar(5),@P6 nvarchar(11))SELECT A.ITEMID,A.VERSIONID,A.PRICETYPE,A.INVENTDIMID,A.MARKUP,A.PRICEUNIT,A.PRICE,A.PRICECALCID,A.UNITID,A.PRICEALLOCATEMARKUP,A.PRICEQTY,A.STDCOSTTRANSDATE,A.STDCOSTVOUCHER,A.COSTINGTYPE,A.ACTIVATIONDATE,A.MCSPMFBATCHSIZE,A.CREATEDDATETIME,A.RECVERSION,A.RECID FROM INVENTITEMPRICE A WHERE ((A.DATAAREAID=@P1) AND (((A.ITEMID=@P2) AND (A.PRICETYPE=@P3)) AND (A.ACTIVATIONDATE>@P4))) AND EXISTS (SELECT 'x' FROM INVENTDIM B WHERE ((B.DATAAREAID=@P5) AND ((B.INVENTDIMID=A.INVENTDIMID) AND (B.INVENTSITEID=@P6)))) ORDER BY A.DATAAREAID,A.ACTIVATIONDATE,A.CREATEDDATETIME DESCBut when I clicked on "query_plan" column in the output, I saw the reason why it took so much time – the wrong plan that started with InventDim table.
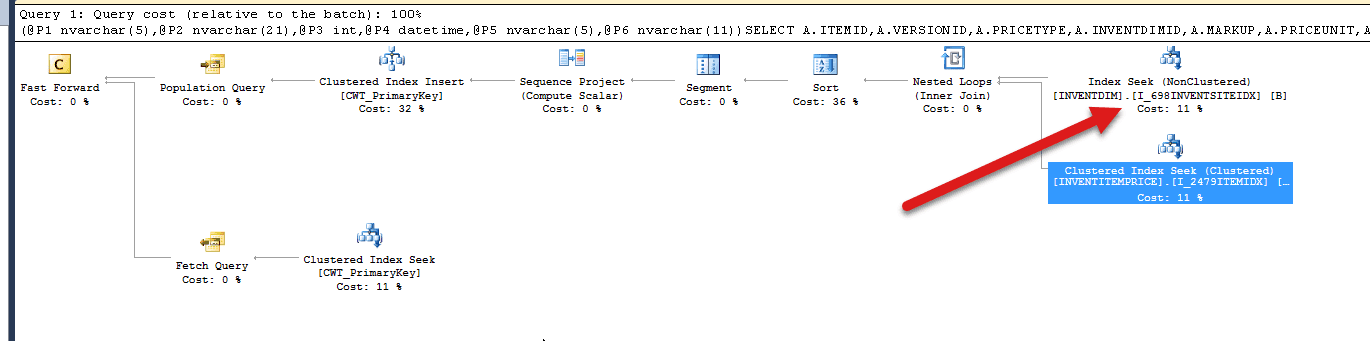
Probably recently they created a new location, and this new location was the first parameter for this query and SQL Server based on the current statistics decided to start the plan with InventDim(that was probably OK for this new location with no data), the plan was cached and caused a performance problem for all other locations.
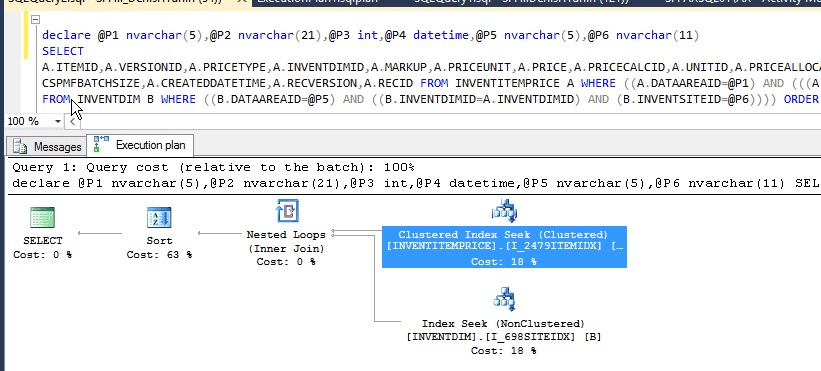
The correct plan should be the following - start the search by ItemId and then check InventDim(it can be obtained by running Display Estimated Execution plan for the query above)
To avoid such situations in the future, I created a custom plan with a "force order" hint
EXEC sp_create_plan_guide @name = N'[AX_InventItemPriceDimSite]', @stmt = N'SELECT A.ITEMID,A.VERSIONID,A.PRICETYPE,A.INVENTDIMID,A.MARKUP,A.PRICEUNIT,A.PRICE,A.PRICECALCID,A.UNITID,A.PRICEALLOCATEMARKUP,A.PRICEQTY,A.STDCOSTTRANSDATE,A.STDCOSTVOUCHER,A.COSTINGTYPE,A.ACTIVATIONDATE,A.MCSPMFBATCHSIZE,A.CREATEDDATETIME,A.RECVERSION,A.RECID FROM INVENTITEMPRICE A WHERE ((A.DATAAREAID=@P1) AND (((A.ITEMID=@P2) AND (A.PRICETYPE=@P3)) AND (A.ACTIVATIONDATE>@P4))) AND EXISTS (SELECT ''x'' FROM INVENTDIM B WHERE ((B.DATAAREAID=@P5) AND ((B.INVENTDIMID=A.INVENTDIMID) AND (B.INVENTSITEID=@P6)))) ORDER BY A.DATAAREAID,A.ACTIVATIONDATE,A.CREATEDDATETIME DESC',
@type = N'SQL',
@module_or_batch = null,
@params = N'@P1 nvarchar(5),@P2 nvarchar(21),@P3 int,@P4 datetime,@P5 nvarchar(5),@P6 nvarchar(11)',
@hints = N'OPTION(force order, loop join)'
After that, the system performance restored to normal, and the CPU load was considerably reduced.
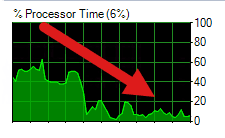
So the troubleshooting was quite easy to perform, the problem was fixed, and this issue will not happen again. The complexity of these steps is that you need someone who understands Dynamics AX DB structure and has access to the SQL Server.
If you have just a SQL administrator who doesn't know AX Database structure, you can create a simple instruction to deal with such problems:
- Run a top SQL query and copy results to Excel(you can copy all columns except the last one - "query_plan")
- Click on the last column - "query_plan" for the first 3-5 rows
- Save them to separate files with .sqlplan extension
- Try to clear the SQL cache with DBCC FREEPROCCACHE command
Then this information may be passed to AX developer in order to fix the problem.
The wrong way to resolve such problems is to perform one of these actions:
-
Restart the system
-
Run reindexing
-
Run statistics update
These actions will clear the current cache, and there is a high chance that the problem will disappear, but it will not be resolved.
A note about Plan Guides: ideally you should keep number of custom Plan Guides to minimum(as they may become invalid if you, for example, modify the table structure). After you fixed the issue with the plan guide, try to think how this can be avoided by modifying the code(typical solutions - create/update indexes, use forceliterals hint in X++, modify the query..)
Some troubleshooting tips(update 18/02/2021)
1.You can view existing plans with their hints in Plan Guides section
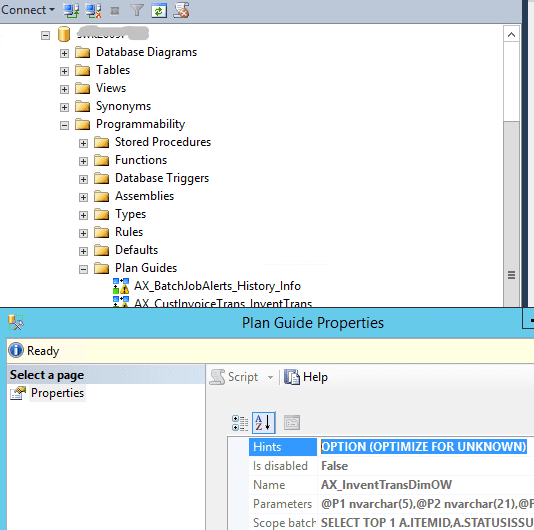
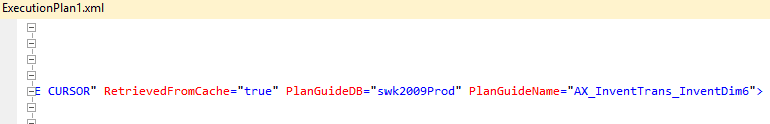
2.In order to check what plan hint is applied for the query, press Show execution Plan XML.. in the plan view, and check the last value for "StmtCursor" tag.
3.You can use a handy tool MSSQLPlanToSpExecuteSql by Denis Sukhotin to convert the plan XLM to a normal SQL with the actual values instead of @P1. Then you can execute this query from SSMS with different parameter values and try to understand why the wrong plan was used
Dynamics 365 Finance and Operations - cloud version
In the above situation, we had access to the SQL box, let's discuss how this can work when we don't have direct access to the SQL Server - in the new cloud D365FO.
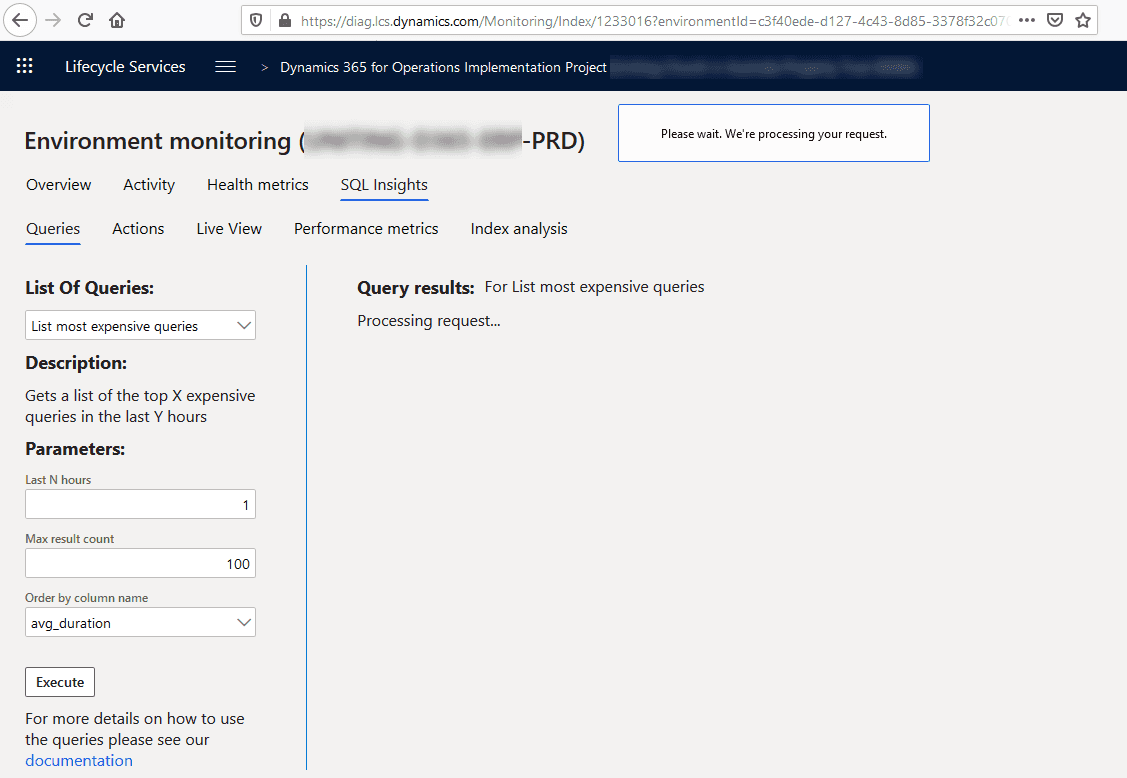
Microsoft proposes to use LCS for this. On the Environment monitoring page you have a "SQL Insights" tab where you can execute the predefined "List most expensive queries" command(full documentation is here)
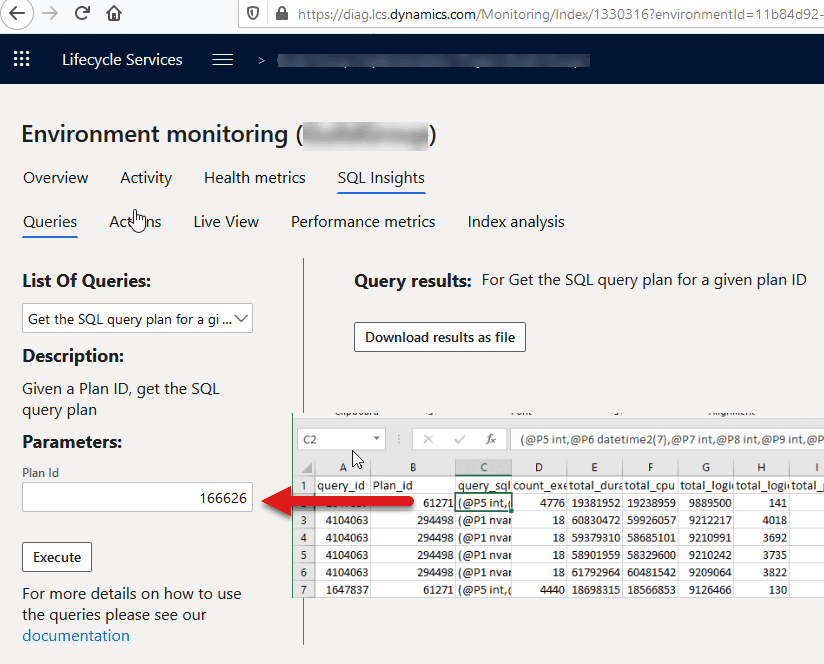
And to check the actual plan you need to get a result of this command and paste it to "Get the SQL query plan for a given plan ID" and this will give you a .sqlplan file that you can open in a local SQL Management studio.
Then there is another command to fix the plan.

So in theory, we should have almost the same tools as we have with on-premise system. But the current problem is that every action in LCS is very slow. I tested these functions on several production environments and typical response time was about 5-10 minutes(you just see "Please wait" message). This time is huge, and the whole system is quite unusable due to this. Moreover, you can't run this in different windows, only one request in time is allowed.
From the practical experience queries that work with SQL plan cache are almost instant even for huge databases, so the current problem is somewhere in communication between LCS and Azure SQL.
Conclusion
If you use the on-premise system(AX2009, AX2012) and have access to SQL Server, make sure that your administrators know how to diagnose and solve parameters sniffing issues. It may happen even for an old system, for example, a case from this blog happened to a seven year old system.
If you are in the cloud - vote for the idea to fix LCS Insights response time
Any comments are welcome
Tagged with:
Written by Denis Trunin
Similar posts:
- How to manage a Dynamics AX performance optimization project
- Comparing D365FO development VMs performance
- How to increase your AX2012R3 database synchronisation speed
- Monitoring the most problematic performance problem in Dynamics AX - parameters sniffing
- Dynamics AX performance audit
- Implementing of Dynamics AX business operations performance monitoring