
Analysing Dynamics AX / Dynamics 365FO batch performance using Power BI
November 25, 2020
Batch task processing plays an important role during Dynamics AX / Dynamics 365FO performance analysis. Batch tasks are executed on a separate server but may affect system performance producing a load to SQL Server database. In this post, I show how to use Power BI to analyse batch performance.
Getting the data
The source data for our report is a Batch execution history table(BATCHHISTORY) where the system logs all batch runs(you need to check that "Save job to history" flag is enabled for a batch job).
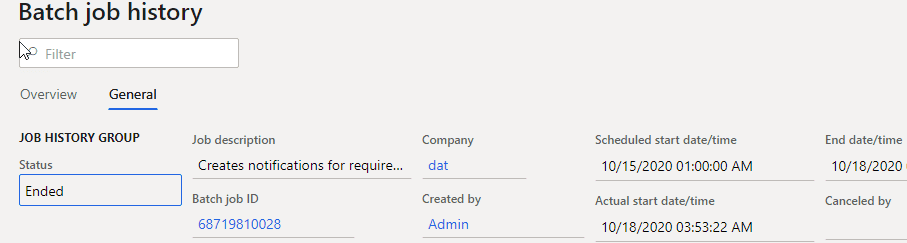
In a lot of cases, you can't install an additional software on a SQL Server to query this data directly. So the easiest way to get the required data is to execute a query in SQL Management Studio and copy/paste its result into the local Excel file. Then this file can be used as a source data for our Power BI report.
See below the sample query that I use for AX2012
DECLARE  @m int
set @m = DATEDIFF(mi,SYSUTCDATETIME(), SYSDATETIME())
SELECT
CASE
  WHEN [BATCHHISTORY].[STATUS] = 3 THEN N'Error'
  WHEN [BATCHHISTORY].[STATUS] = 4 THEN N'Finished'
  WHEN [BATCHHISTORY].[STATUS] = 8 THEN N'Canceled'
  ELSE CONVERT(nvarchar, [BATCHHISTORY].[STATUS])
END as [STATUS]
      ,[BATCHJOBHISTORY].[CAPTION] as [BatchCaption]
      ,[BATCHHISTORY].[CAPTION]    as [TaskCaption]
      ,[BATCHHISTORY].[BATCHJOBID]
      ,[BATCHHISTORY].SERVERID
      ,(SELECT TOP 1 [Name] FROM [DynamicsAXProd_model].[dbo].[ModelElement] where axid = [BATCHHISTORY].CLASSNUMBER and ElementType = 45) as ClassName
      ,[BATCHHISTORY].CLASSNUMBER
      ,DATEADD(minute, @m, ORIGSTARTDATETIME) as [ORIGSTARTDATETIME]
      ,DATEADD(minute, @m, [BATCHHISTORY].[STARTDATETIME]) as [STARTDATETIME]
      ,DATEADD(minute, @m, [BATCHHISTORY].[ENDDATETIME]) as [ENDDATETIME]
      ,DATEDIFF(ss, [BATCHHISTORY].STARTDATETIME, [BATCHHISTORY].enddatetime) as [DurationSec]
      ,[BATCHHISTORY].[COMPANY]
      ,[ALERTSPROCESSED]
      ,[BATCHCREATEDBY]
      ,[CANCELEDBY]
      ,DATEDIFF(mi, [BATCHJOBHISTORY].ORIGSTARTDATETIME, [BATCHJOBHISTORY].STARTDATETIME) as [StartDelayMin]
  FROM [dbo].[BATCHJOBHISTORY], [dbo].[BATCHHISTORY]
where
[BATCHHISTORY].BATCHJOBHISTORYID = [BATCHJOBHISTORY].RECID and
DATEADD(minute, @m, [BATCHJOBHISTORY].[STARTDATETIME]) > CONVERT(datetime, '2019-08-12', 120)
You need to adjust STARTDATETIME filtering, limiting the number of rows to 100-200k(start with one previous week for example). For D365FO you can also create a data entity for it or just run this query for a PROD database copy.
Batch analysis reports
Let's see what kind of reports we can build from this dataset:
- Total duration
The first report we can build analysing Total duration of batch tasks from different measures

The first visual here displays Total duration by task name, where we can find what are our longest tasks and then invest our time into optimizing top tasks from this list.
The second visual displays how busy our batch servers were(Duration by ServerID). In the example above we can see that the amount of work executed on AOS01 is way less than on AOS02, so maybe it is a good idea to relocate some tasks to it.
And the third visual displays the number of batch tasks and their duration by company, so we can define our top companies.
- Delayed batch tasks
There can be a situation where a batch task is scheduled for a particular time but was not executed on this time because there were not free threads available. We can calculate the delay as the differences between StartDateTime and OrigStartDateTime columns.
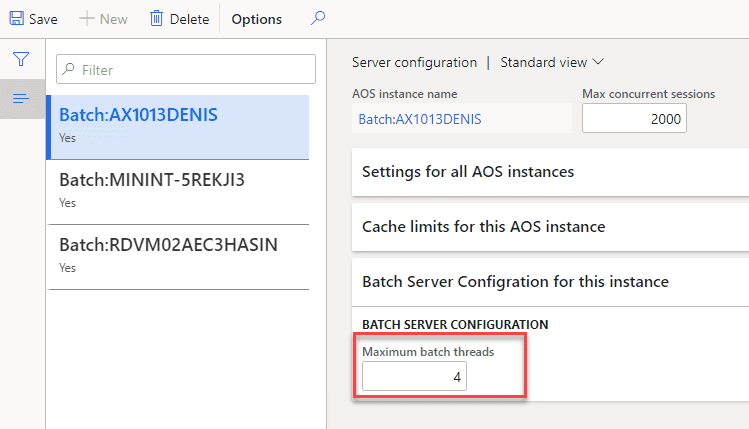
One of the main parts of configuring a batch server is to specify a "Maximum batch threads" that it can handle. The situation where you have delayed tasks is not normal, on a properly configured system this should never happen.
From practical experience: don't set this value too low. A modern 8-core server can handle 50-200 batch threads, so start with this interval. There can be some specific batch jobs that mostly use AOS resources and no SQL work, only in this case it may be set lower. Check for % of AOS CPU usage.
The second report displays such delayed tasks.
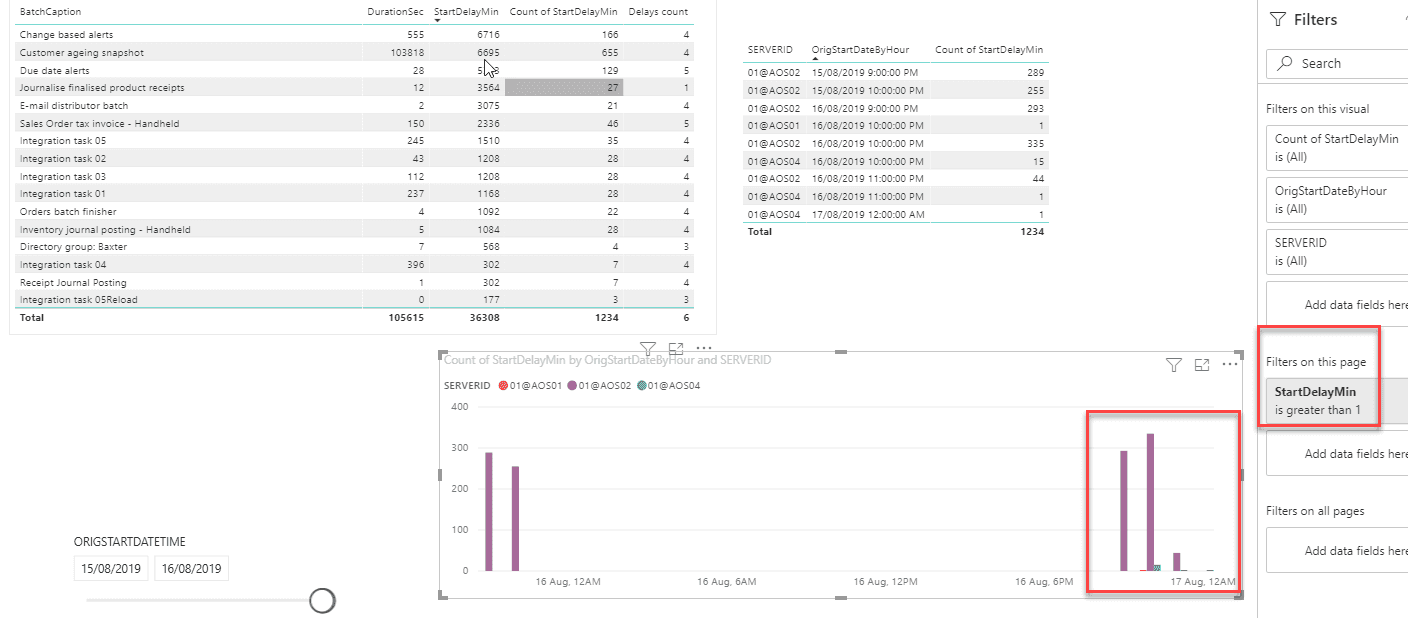
It allows identifying which tasks were delayed, on what server and at what time. In the example above we see that there were a lot of delayed tasks around 9 pm. It was a project case where we have found that "Customer ageing report" was incorrectly configured and that overloaded batch server with multiple tasks. If you see some custom jobs here maybe you need to review your batch strategy
Batch tasks schedule
Another important part of AX performance analysis is analysing how batch tasks are scheduled during the day. Usually, it is not a problem if a large task is executed at night, but if it runs during the day it may affect users' work.
The third report displays how the top batch jobs were executed during the day.
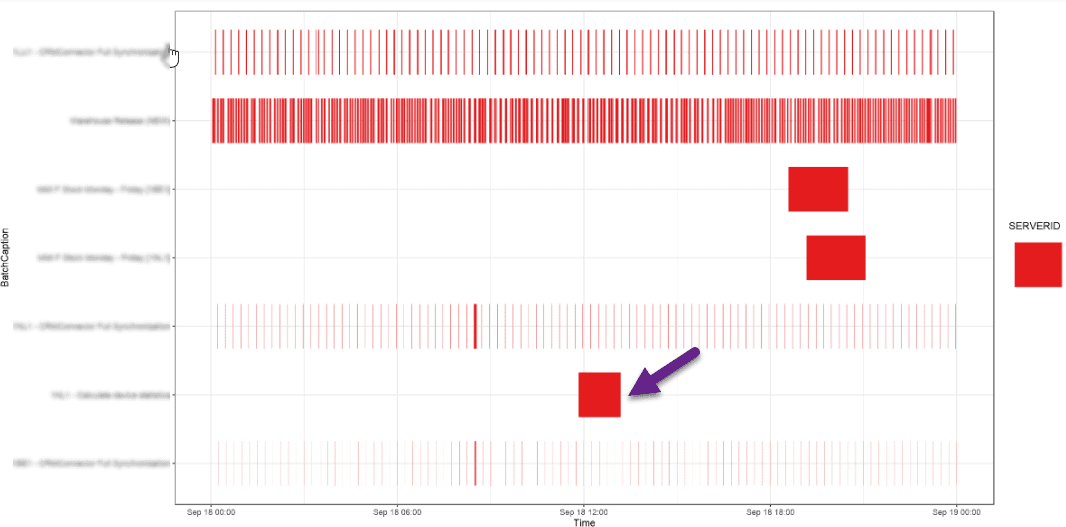
We see that there are 2 big tasks executed after 7 pm and one big task executed around 1 pm. Then it is worth discussing whether we need it in the middle of the day and how we can optimize it.
Conclusion
With the help of Power BI you can analyse 3 main points of Dynamics AX/ D365FO batch tasks performance: Longest tasks, Delayed tasks and Schedule during the day. I upload files used for this post to the following folder
I hope you find this information useful. As always, if you see any improvements or suggestions, don't hesitate to contact me.
Tagged with:
Written by Denis Trunin
Similar posts:
- Implementing Dynamics AX 2009/2012 database cleanup
- Implementing of Dynamics AX business operations performance monitoring
- Dynamics AX performance monitoring: missing indexes
- Batch Job errors in D365FO: How they can ruin the performance and how to fix them
- Blocking in D365FO(and why you shouldn't always follow MS recommendations)
- A simple way to implement a parallel batch processing in X++