
Do we really need index hints? (forceLiterals vs forcePlaceholders)
December 10, 2018
The idea to write this post came after a discussion of the new PU23 feature “Enabling index hints in X++ again”
And the main question during the discussion was – Do we really need “index hint” for the modern SQL Server?
First, let's discuss the basic methods of SQL query generation. In D365FO we have 2 ways of executing a SQL statement
ForcePlaceholders
This is the default query execution mode. In this case, every SQL Statement that you write in X++, is processed in 2 steps – first sp_prepare command executed with placeholders instead of actual values and as a result of this sp_prepare command, we get a cached plan. Then sp_cursorexecute is called, that executes the query using this plan and the actual values. For one SQL statement with the different values, the plan is calculated only once.
How does SQL server determine what plan to generate in sp_prepare if the statement is new (for some values one plan may be more efficient than for others)? For new unknown plans it uses a “parameters sniffing” feature. If it gets sp_prepare command for a new statement, it doesn’t try to calculate it immediately, instead, it waits for the first call of sp_cursorexecute and uses the first passed values to calculate the plan.
ForceLiterals
In this case, your current SQL statement (with the actual values) is sent to SQL Server and executed as it is. The drawback of this is that for every set of values you will need to parse this statement and compile a new SQL plan.
Parameters sniffing
Parameters sniffing quite often becomes a reason for performance problems. For example, you have a warehouse where most of the items have one batch ID, but there are some Items and Batches with general names (like “No batch”, “Empty”). In this situation, when you query item by batch your actual plan depends on the first query values. If your query contains “general” batch values, SQL Server creates a plan that starts execution with the ItemId, as a “general batch value” is not selective in this case. But for most of your items, it will be wrong and gives huge overhead, as in most cases Batch is a unique value.
How to resolve a Parameters sniffing issue:
There is no universal way to resolve Parameters sniffing issue(refer to the excellent BrentOzar post that describes this https://www.brentozar.com/archive/2013/06/the-elephant-and-the-mouse-or-parameter-sniffing-in-sql-server/ ), but there are several ways to deal with it in D365FO
- Create new indexes – you can create new indexes, to help SQL server always choose the best plan. This often works only if you have conditions to one table only
- Use the sp_create_plan_guide command to force the actual plan – using this option creates a big admin overhead as you need to maintain these created plans. If you add a new field to the AX table you will need to change all the plan guides in which this table is used
- forceLiterals hint –you send actual values to the SQL Server and it chooses the best plan for these values. The overhead is that the plan will need to be compiled every time
- Use index hint (new feature in PU23) – it is the same as sp_create_plan_guide but with no admin overhead
Overhead of forceLiterals usage
Let’s check, what is the overhead of forceLiterals usage(I have tested this on medium size AX2012 DB and on D365 8.1 demo, time proportions were the same in both cases)
For the test let’s use the following job. It calculates actual item quantity for the warehouse.
class dev_testForceLiterals
{
    public static void main(Args _args)
    {
        InventTable         inventTable;
        InventDim           inventDim;
        InventSum           inventSum;
        InventLocation      inventLocation;
        int                 curCount, maxCount = 5000;
        System.Diagnostics.Stopwatch stopwatch = new System.Diagnostics.Stopwatch();
        real                         timeMs;
        ;
        stopwatch.Start();
        while select inventTable
        {
            while select inventLocation
            {
                //select forcePlaceholders  //case 1
                select forceLiterals        //case 2
                    sum(AvailPhysical) from inventSum
                group by ItemId
                where inventSum.ItemId == inventTable.ItemId &&
                      inventSum.Closed == false
            exists join inventDim
                where inventDim.inventDimId      == inventSum.InventDimId &&
                      inventDim.InventLocationId == inventLocation.InventLocationId &&
                      inventDim.InventSiteId     ==   inventLocation.InventSiteId;

                curCount++;
                if (curCount > maxCount) break;
            }
            if (curCount > maxCount) break;
        }
        stopwatch.Stop();
        timeMs = stopwatch.get_ElapsedMilliseconds();
        info(strFmt("Time for %1 lines: %2 sec", curCount, timeMs / 1000));
    }
}
Before each run we will clear SQL plan cache using the following command (note that this command only clears plan cache, not the data cache, all used tables are still located in the memory)
DBCC FREEPROCCACHE
GO
To calculate memory consumption after each run we will use the following statement
SELECT objtype AS [CacheType]
, count_big(*) AS [Total Plans]
, sum(cast(size_in_bytes as decimal(18,2)))/1024/1024 AS [Total MBs]
, avg(usecounts) AS [Avg Use Count]
, sum(cast((CASE WHEN usecounts = 1 THEN size_in_bytes ELSE 0 END) as decimal(18,2)))/1024/1024 AS [Total MBs - USE Count 1]
, sum(CASE WHEN usecounts = 1 THEN 1 ELSE 0 END) AS [Total Plans - USE Count 1]
FROM sys.dm_exec_cached_plans
GROUP BY objtype
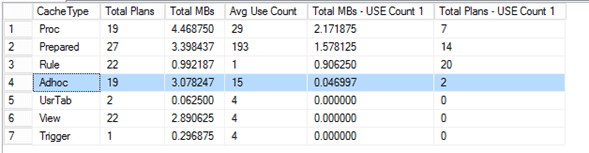
ORDER BY [Total MBs - USE Count 1] DESCforcePlaceholders results
For the first and for the second executions, time was the same
First run: 8,51 sec
Second run: 8,51 sec
Memory consumption:
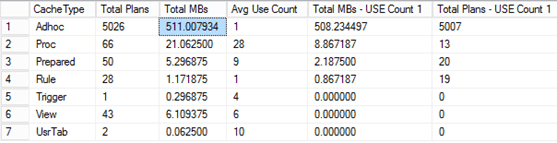
forceLiterals results
First run: 66,57 sec
Second run: 9,60 sec
Memory consumption:
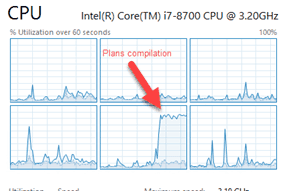
During the execution there was almost 100% utilization for 1 CPU core
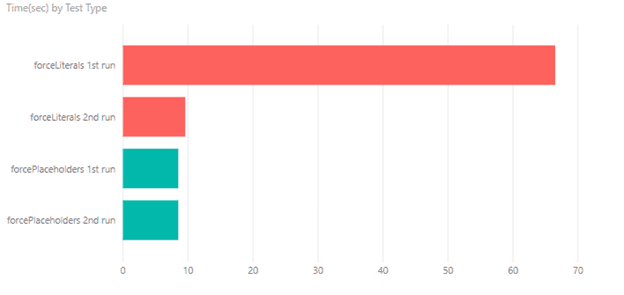
If we present these values on a graph:
Memory consumption is about 100KB per saved plan. So in forceLiterals case, it requires a 500MB memory per 5k SQL statements. This is a large amount of memory just for the plan cache.
Summary
Plan compilation is still a complex task, that consumes a lot of CPU. This 1-minute difference between the first run of forceLiterals and forcePlaceholders is utilizing one CPU core for 100%. For the forceLiterals case, time to build a plan is 6 times longer than the time to fetch the actual data. Also, notice a difference between the second run of forceLiterals and forcePlaceholders. It is about a second – this time is a time server spends doing lexical parsing of SQL statement.
For single SQL statements (or statement that executes once per document header) forceLiterals can provide some benefit, but if we have a large number of users who are working with different items and different dimensions forceLiterals usage for the frequent SQL requests can affect overall SQL server performance (both for memory consumption and CPU), so we need to avoid forceLiterals usage on a "per line" level. And the new “index hint” feature can help us in this.
Tagged with:
Written by Denis Trunin
Similar posts:
- Analysing Dynamics AX / Dynamics 365FO batch performance using Power BI
- Comparing D365FO development VMs performance
- Dynamics AX performance audit
- D365FO Performance. Periodic import of one million ledger journal lines
- Improving Dynamics AX2009 / AX2012 logistics performance by denormalizing InventSum table
- Resolving performance issues caused by parameters sniffing in AX2012 and D365FO