
Examples of AX2012/ AX2009 performance problems
January 08, 2020
Introduction
In this post, I try to describe some performance-related issues that I faced on client projects(mostly versions AX2009 and AX2012R3) and how they were resolved.
It is more like a collection of examples for my previous post Dynamics AX performance audit. It also illustrates the initial concept described in this post: a performance analysis should be performed from the highest level and to continue by going deeper in details.
Server related issues
There was a set of problems where users complained about the "slow system" in general
Shared hardware usage for AX SQL server
This issue was quite an unusual one. The whole AX implementation was installed on VM cluster where every CPU core shared between several VMs. The number of VMs allocated to the same CPU core is called CPU allocation ratio, and it was 1 to 5. You probably can save your money on hardware and electricity costs using such configuration, but as a result, overall system performance was very slow, especially during the day. Microsoft Dynamics AX 2012 System Requirements document clearly says that dedicated hardware should be used.
How to detect: I don't think is possible on Windows level, the best option is to ask IT support. Leading cloud providers always provide you with dedicated hardware
Database mirroring setup
One client set up a database mirroring using “High safety without automatic failover” mode. In this mode, a process waits for transactions to commit on both servers. This setting caused massive IO delays(like one record inserts for several seconds), not supported by Microsoft and solution was to switch on "High-performance" mode for mirroring settings.
How to detect: Such issue is quite easy to identify using Wait statistics script. If you see that more than 80% waits are disk related, it is a time to check what the reason for this is.
Slow performance due to low SQL Server memory
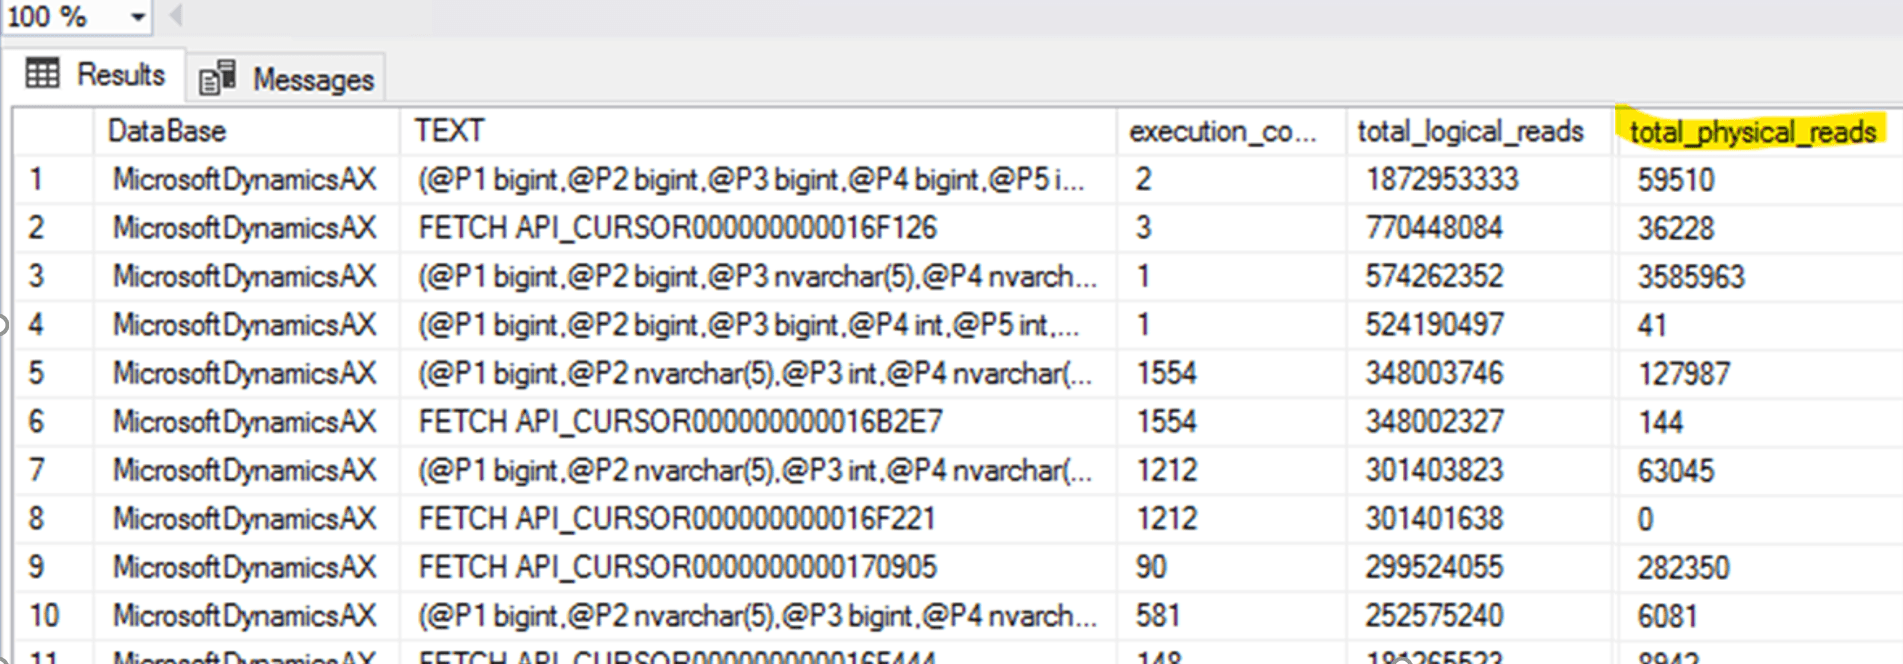
Dynamics AX is an OLTP system; it should not read any data from the disk during routine daily operations and SQL Server should have enough memory to hold the active data. If you don't have it - the available memory should be increased
How to detect: Check TOP SQL queries during the day – if you have a lot of physical disk reads, it is time to increase SQL Server memory(queries, of course, should have proper indexes)
SQL Server issues
Missing indexes
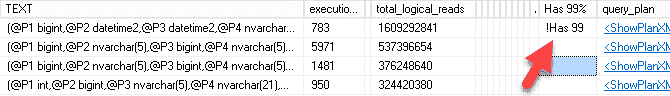
That is a common problem. Usually, you use a missing index query to find such indexes, but I also added a new column to TOP SQL query - "Has 99%" that allows to quickly see your TOP SQL queries that have 99% missing index impact recommendation
Parameters sniffing
Parameter sniffing can be a huge problem, especially if you have separate teams responsible for SQL Server and AX. We had a case where a client complained about periodic slow ledger journal posting that stopped the work of a whole accounting department.
In that case, the reason was just one custom query affected by parameters sniffing(not the optimal plan was initially selected and cached). Before the performance audit client spent about a month with tons of e-mails between AX team, SQL team and Microsoft support trying to implement typical recommendations like statistics refresh, re-indexes with a different fill-factor and so on...
The issue has been quickly resolved by creating a new plan guide with OPTIMIZE FOR UNKNOWN hint.
How to detect: To start with you need to analyse "Get Top SQL" output and check queries from the top. Often, the first step is to compare the actual plan with the Unknown parameters plan. To do this:
- Copy a query to a new SQL window and replace “(“ with “declare” and remove the last “)”
- Press “Display estimated execution plan” button
Compare it with the plan from the "Get Top SQL" output; if they are different, you need to analyse why.
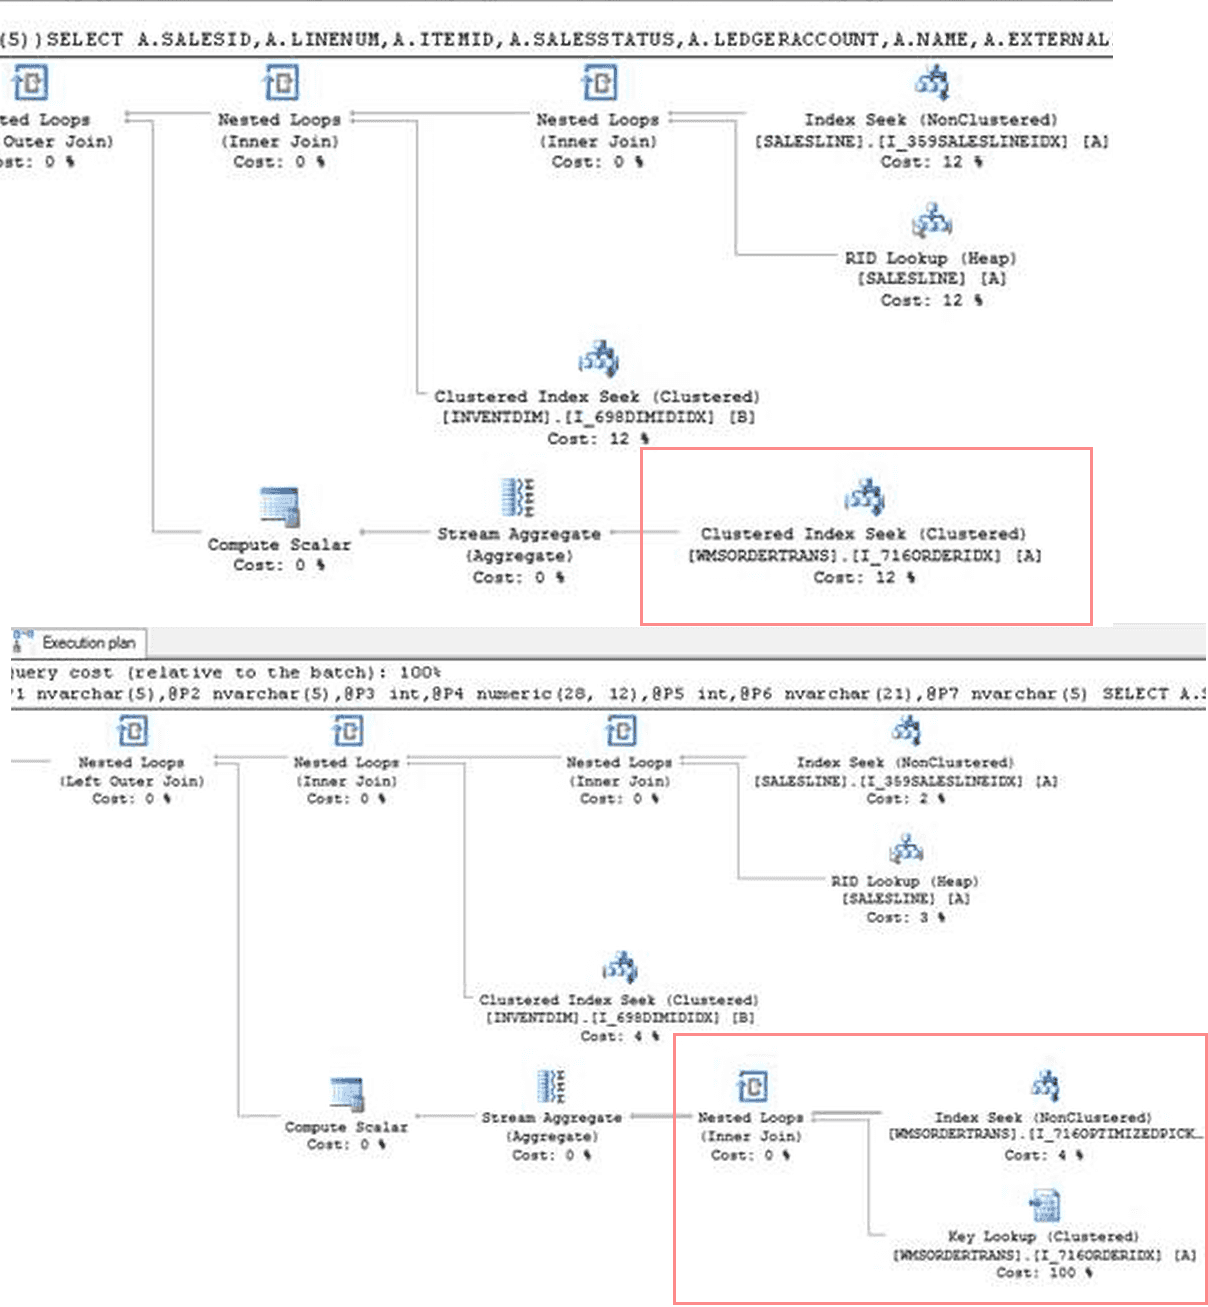
You need to know what logical reason for this query is, how data is distributed in your tables, how unique(or how selective) each condition in the select query is, why SQL Server generates two different plans and which plan is the correct one.
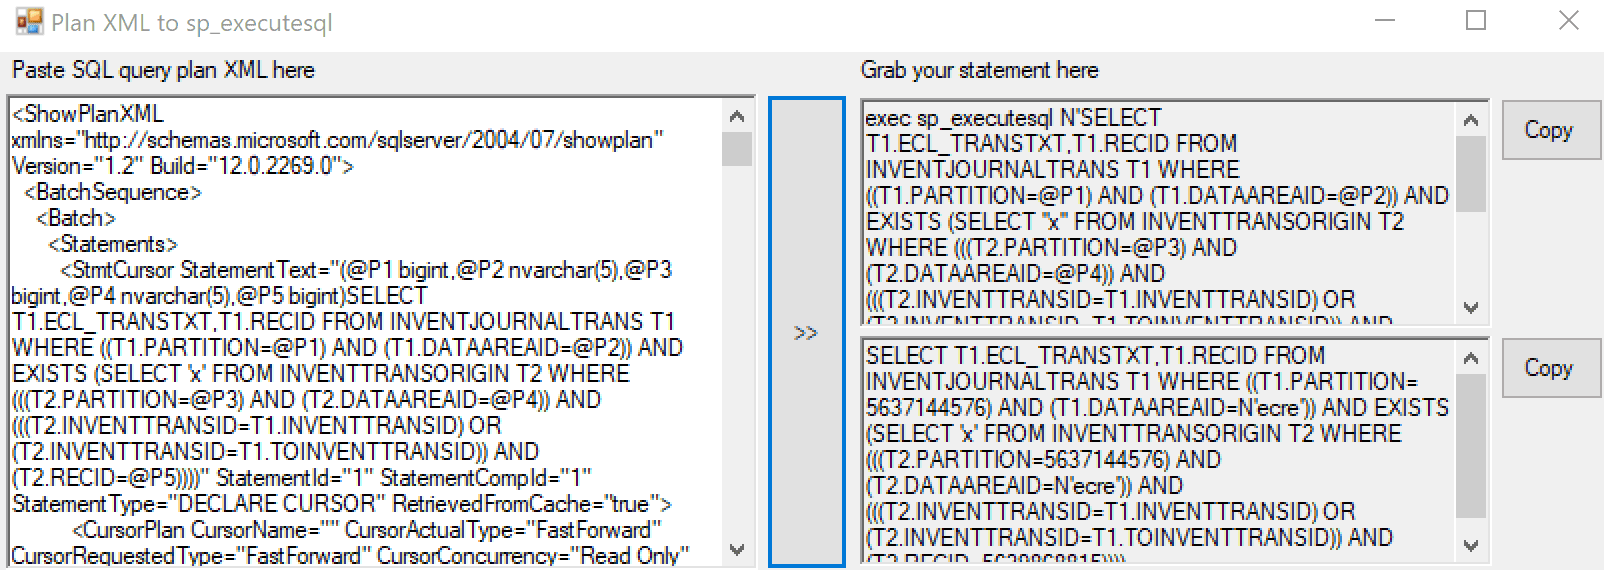
To view actual parameters for the plan in the cache you need to press "Show Execution Plan XML.." on the plan itself and scroll to the bottom. You can use a handy tool MSSQLPlanToSpExecuteSql by Denis Sukhotin to convert this XLM to a normal SQL with the actual values instead of @P1. Then you can execute this query from SSMS with different parameter values.
Some queries can be fixed only by changing the X++ code. For example consider the following code, that gets total quantity for the specified Item on a License plate.
select sum(AvailPhysical) from inventSum
    where inventSum.ItemId == @P1
join inventDim
    where inventDim.inventDimId == inventSum.InventDimId &&
          inventDim.LicensePlateId == @P2;
"License plate" is a very selective field, so for the normal parameters InventDim(LicensePlateIdIdx) index will be used. But what happens if we try to execute this statement with @P2="". If we had this plan in the cache, the system would scan all InventDim records with empty LicensePlateId(and this will be a huge number of records) or if it were the first run, it would start processing this select with ItemId field, that is not so selective. Both options are incorrect and will lead to problems. But from the logical point of view LicensePlateId="" doesn't make any sense, so instead of trying to fix this statement, we need to fix its parameters. In this case, a developer just forgot to add a check for an empty value, and the solution was to add this check and not to run this statement if @P2 is empty.
The main advice here is never use statistics update or re-indexing to solve such issues, in the origin blog post I have some links what the approach should be(like additional indexes, hints in AX, convert to forceliterals, create custom plan..)
AOS and Terminal servers issues
Waiting time for batch tasks
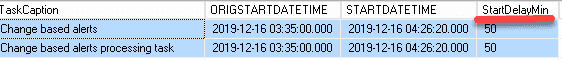
A client complained about slow integration. During the analysis, I found that for the integration they used a batch job that should be executed every minute, and sometimes it wasn't.
There is one old recommendation on the Internet that when you set up an AX batch server, you should allocate only several threads per CPU core. In this case batch server was set up with 32 threads and such low setting caused batch execution delays(as there were no free threads available). To identify such problems, I created a SQL query that compares batch job "Planned execution start time" with the "Actual start time". If you see some differences between these numbers, you have the same problem.
My advice here is to increase this "Maximum batch threads" parameter for AOS until you have CPU and Memory resources(modern server can handle hundreds of threads). It is interesting that in the new D365FO version Microsoft has added Batch priority-based scheduling(PU31), but this feature probably just hides the problem.
Huge delays during sales orders posing and printing
That was a quite interesting and complex case. A client complained about periodic delays(1-2 minutes) during sales orders posting. The issue couldn't be replicated(initially it looked like typical parameters sniffing or blocking issue). The problem was that they also had a lot of other performance issues(a lot of missing indexes, old SQL version, High CPU load on SQL server and so on...). The client used AX2009 and they outsourced three different companies to support Infrastructure, SQL and AX side.
When we fixed all performance issues, the system load became low, but they still sometimes complained about the original issue and we still couldn't replicate it(in all our tests small orders posted within several seconds). Setting up a SQL blocking alert and analysing TOP SQL also didn't show any problem. We ended up with a monitoring modification that logged different stages of sales invoice posing. The first finding was that posting time didn't depend on the number of sales order lines, next iterations showed that delay was caused by the "print" method. Finally, we found the reason for this delay - users used Windows2016 Citrix clients(AX2009 does not support that) and in our tests we used Windows2008R2 RDP to run AX client. Printer driver reconfiguration solved this issue.
Slow standard operations
A lot of clients experienced issues with operations already fixed by Microsoft.
Top 2 problems that almost all clients had:
- Batch tables deadlocks - was fixed in CU13 KB3209851Continuous deadlocks in batch tables - Microsoft switched locks processing to application locks
- Locks and deadlocks on InventSumDeltaDim - was fixed in KB4019571 Deadlocking on InventSumDeltaDim causes Sales order release batch to fail. The solution is quite simple - delete RecId index and replace it with TTSItemCheckDimIdx
The best way to start any performance investigation if users are complaining to individual operations is to search for the solution on the LCS "Issue search"(you can search by description or by AOT element name). For example for AX2012R3, there are 120 resolved performance-related fixes to different parts of the system(you can view the full list searching by "slow")

Also, it is helpful to have the latest standard version on AX2012 and use it as a reference(if you have such application you can also extract hotfixes from it as xpo)
With the latest version definition there is a trick - if you google "latest AX version" you will probably find this page - Overview of Microsoft Dynamics AX build numbers. The problem with this site that it is not updated anymore. Current AX2012R3 latest version(both for the Binary and application) is called "August 2019 release". It can be downloaded from LCS - AX2012 project - Updates - UPDATE INSTALLER FOR MICROSOFT DYNAMICS AX 2012 R3
Application issues
I saw these settings that affected performance:
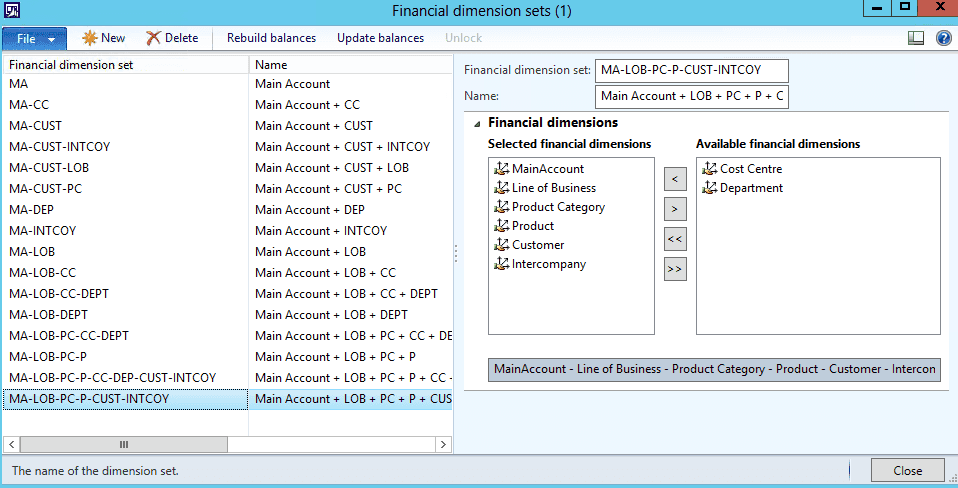
Unused Financial dimension sets
Some customers initially created a lot of “Financial dimension sets” but used only several of them. For example, the setup below means that when the system creates a one ledger transaction – 16 different dimension set transactions will be created(they are used in Trial balance report)
To get what was used, I created the following query(it displays the number of unprocessed records per dimension set):
select count(*) as NumberOfRecords, DimensionHierarchy.NAME from DIMENSIONFOCUSUNPROCESSEDTRANSACTIONS join DimensionHierarchy on DIMENSIONFOCUSUNPROCESSEDTRANSACTIONS.FOCUSDIMENSIONHIERARCHY = DimensionHierarchy.RECID
group by DIMENSIONFOCUSUNPROCESSEDTRANSACTIONS.FOCUSDIMENSIONHIERARCHY, DimensionHierarchy.NAME
The solution was to delete unused sets
Pending workflow tasks
If you use workflow, you need to check that the number of tasks in a Pending status will not grow. You can check for such tasks in the Workflow history form and if there are some old and unused Pending tasks - delete them.
Summary
In this post, I tried to provide some examples of what can be found during the performance review. The original post that describes the review process is here, all scripts related to it are available on my GitHub. If you see that something is missing or want to share some performance-related stories, feel free to post a comment.
Tagged with:
Written by Denis Trunin
Similar posts:
- Comparing D365FO development VMs performance(VS2017)
- Do we really need index hints? (forceLiterals vs forcePlaceholders)
- Dynamics AX performance monitoring: missing indexes
- Dynamics AX performance audit
- Implementing of Dynamics AX business operations performance monitoring
- Implementing Dynamics AX 2009/2012 database cleanup